Making data easier to understand through charts is an important part of creating useful content for your website. There are a lot of free online chart generators, such as Online Charts or Raw, which creates amazing cutting-edge chart designs, but most are not so easy to use when you just need a quick chart for your website.
Beam is a basic graphing tool from Venngage and while you do need to provide your name and email, it’s free and best of all, very simple. Here’s how it works:
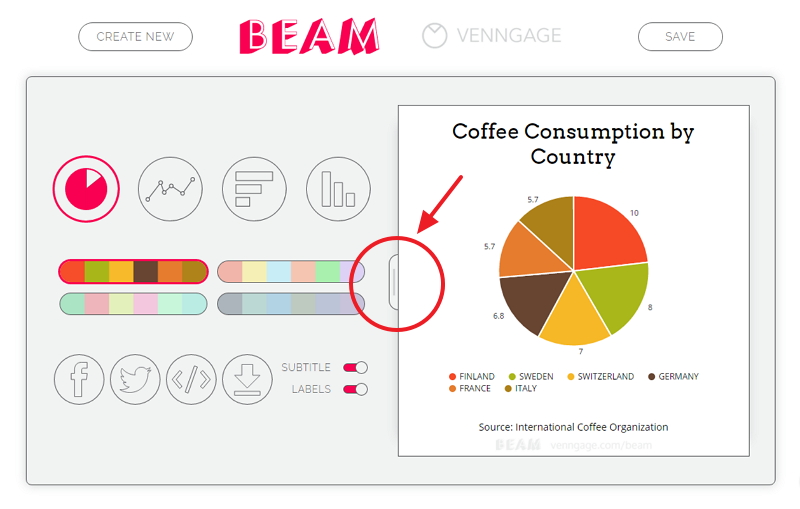
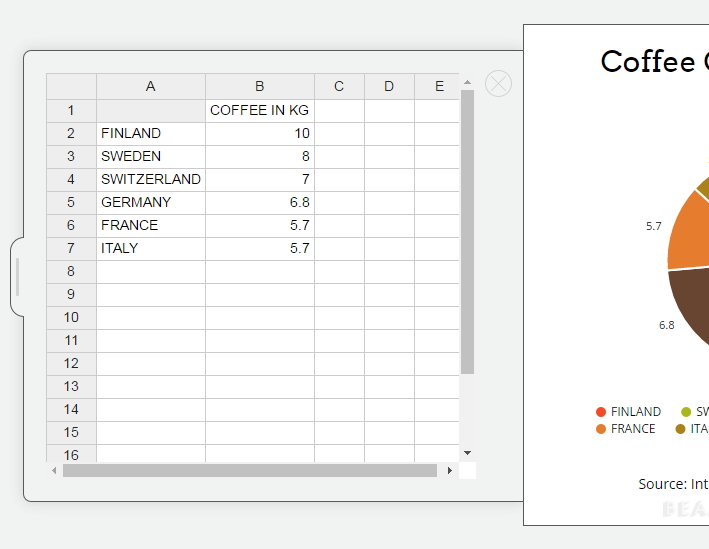
Open the slide-out window to enter your data:
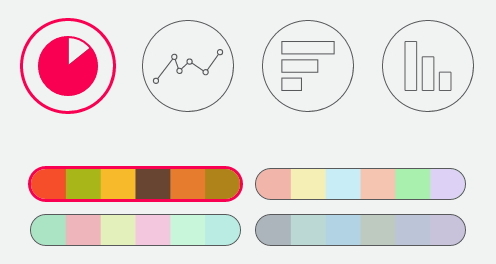
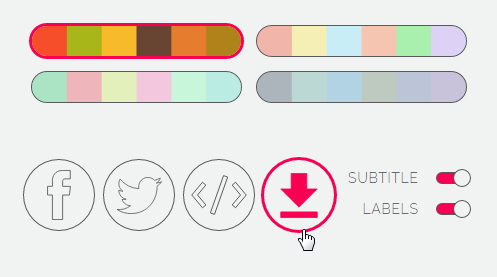
You have a choice of four chart styles: pie chart, plotted graph, horizontal bar chart or vertical bar chart. And while the colour combinations are limited – they’re easy to use.
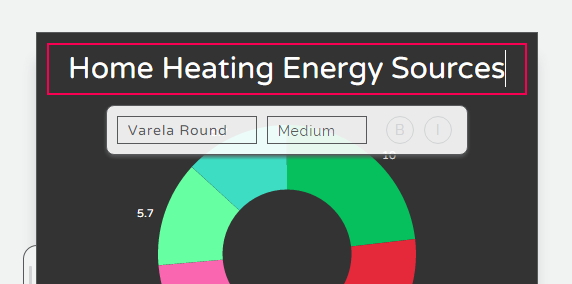
Then you enter your title, choosing your font, sizing, and styling as well:
You can also change or remove the sub-title at the bottom, and then you’re done:
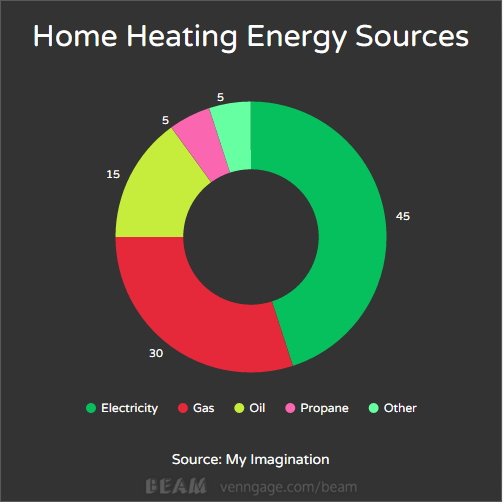
At which point you can share your chart via social media or, as I did here, download it and use it on your website. However, you do have to create an account to do any of this – give your name and email – but at that point you can share and download projects as much as you want.
What's Your Take?