 Google Analytics offers a huge range of reports on your site’s visitors. But that choice of reports be overwhelming. And individual reports can sometimes contain so much information that new users’ eyes glaze over. Custom Dashboards are one way to navigate this vast array of statistics.
In this article, I show you how to get started with your own custom dashboard. In subsequent articles you’ll learn how to add more information to it.
Creating A Custom Dashboard
There are two key advantages to having custom dashboards:
- To simplify existing reports
- To create statistical combinations not available in an existing report
For example, the existing Page Views reports have a lot of useful numbers on them:
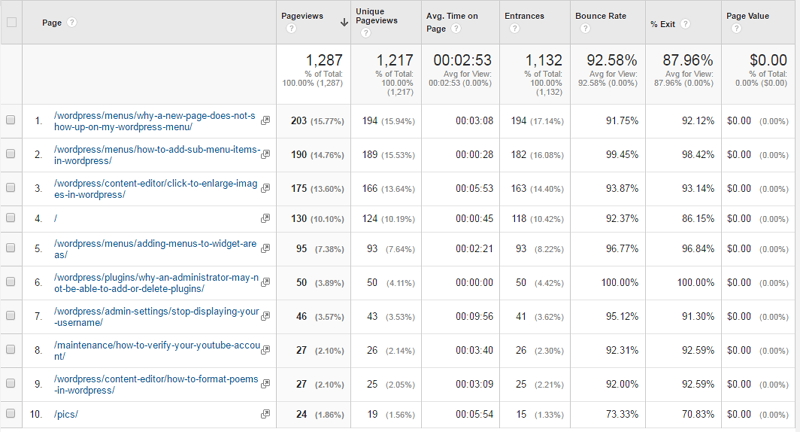
But for new users or for quick checks, that can be a lot of information. To begin our new dashboard, we’re going to narrow these statistics down to just Pageviews and Time On Page, so it looks like this:
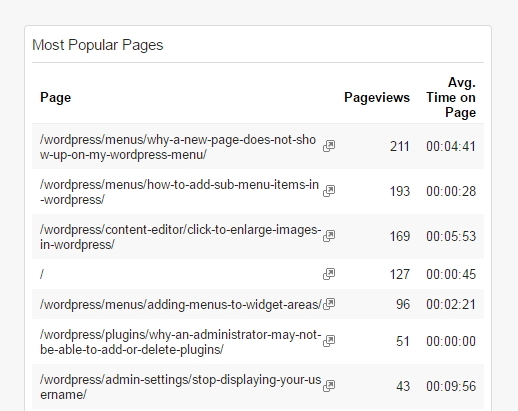
Ok, let’s get started.
Locate the New Dashboard Link
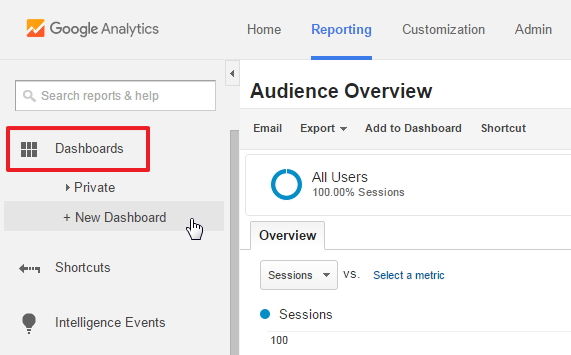
At the top of the left-hand menu for Reports is the Dashboard area, and clicking on Dashboards reveals any existing ones as well as the New Dashboard link.
Choose the Dashboard to Add
Clicking New Dashboard pops up a small window where you choose whether to add a Blank Canvas or a Starter Dashboard. You also have the opportunity to name your new dashboard.
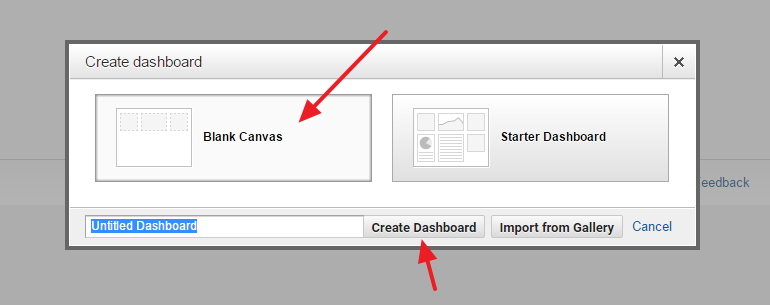
The Starter Dashboard, as the name suggests, provides some useful statistics to get you going and then you can add more of your own, but for simplicity we’re going to use the Blank Canvas. Name your new dashboard and then click Create Dashboard.
The Import Gallery button lets you choose from hundreds of user-contributed Dashboards, nicely catalogued by the kinds of statistics they focus on. You can also use this button to import a dashboard file you may have found on a website.
Adding Your First Widget
When you click Create Dashboard, a new popup window immediately appears, asking you to create a widget.
Dashboards are just collections of widgets, and each widget is a mini-report that you can edit at any time, rearrange on the screen, or delete at a later date.
To create your first widget, give it a title. Then you need to choose between Standard and Real Time. Standard widgets will display statistics from whatever time frame you choose, whereas Real Time widgets will always show what’s happening on your site at the moment you’re view the dashboard. In this case we’re using Standard.
You then have a choice of the report format. Don’t worry about all the options – we’re going to use a Table format for this widget.
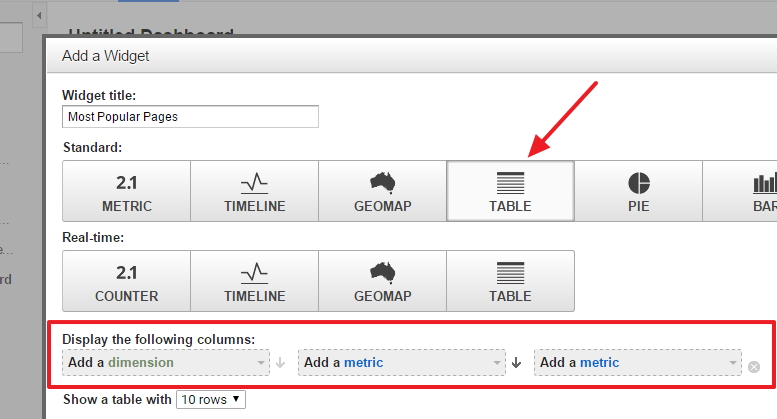
Depending on which report type you choose, you’ll be presented with a list of options for what the report is going to display; in this case, the columns of the table.
Choose What Your Widget Will Display
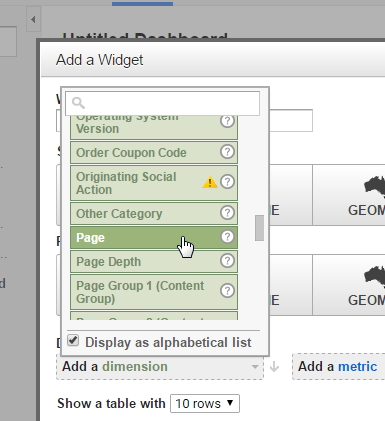
The first column of our table is the dimension, that is, the item that’s going to be measured. We want a report to help us understand the most popular pages on our side, so the dimension we need is Pages:
Now we need a metric or something to measure Pages by. We want to know how many times the page has been viewed, so select Pageviews:
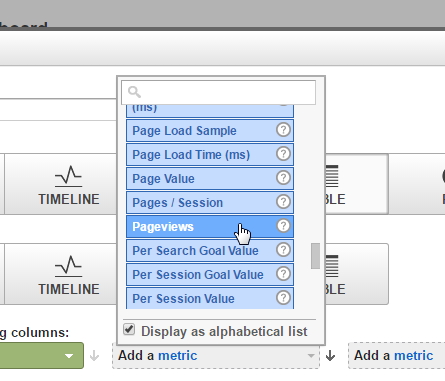
There’s another metric called Unique Pageviews, which filters out users who look at the same page more than once during a visit, but for the moment we’ll just go with the total Pageviews. You can always add or remove metrics later.
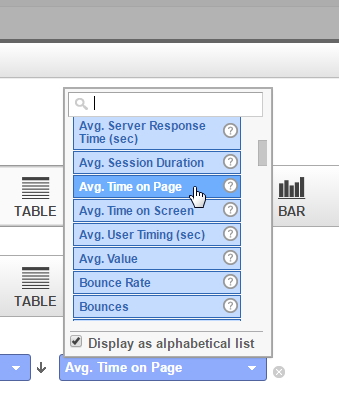
Finally, we’ll add the metric Average Time on Page. This helps to tell us how engaged visitors are when they visit the page. Do they leave right away or do they stop and read?
Save Your Widget
Once you’ve selected the dimension and metrics for your widget, you can save it:
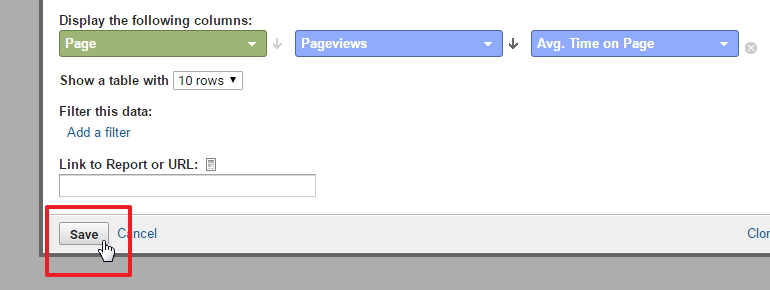
You can also choose how many rows your table will show. The default is 10 and you can change this any time. There’s also the option of filtering the data, but that’s an advanced feature we don’t need to worry about here.
You now how have a custom dashboard with a single widget:
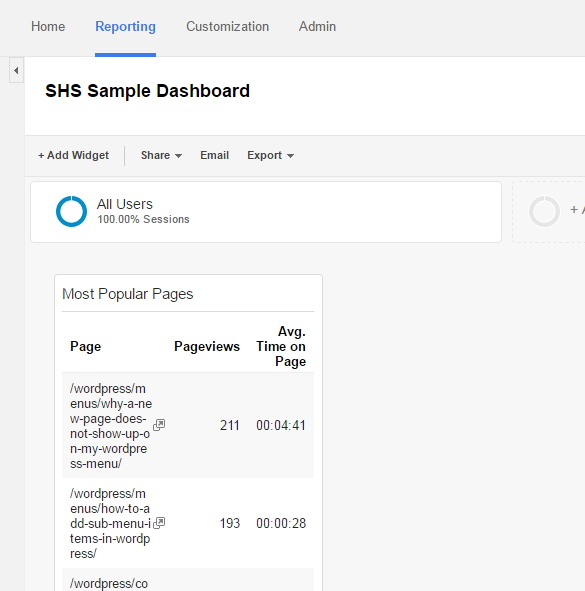
Customize Your Dashboard Layout
This widget feels cramped with the default layout, so let’s change it. At the top right, below the date range of your dashboard is a link to Customize Dashboard.
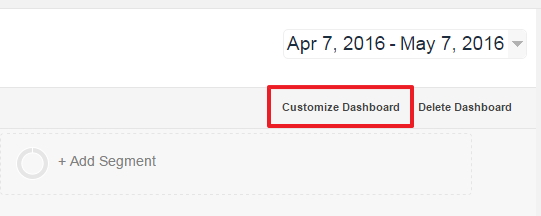
Click on that link and you’ll get a popup window with different layouts for your dashboard:
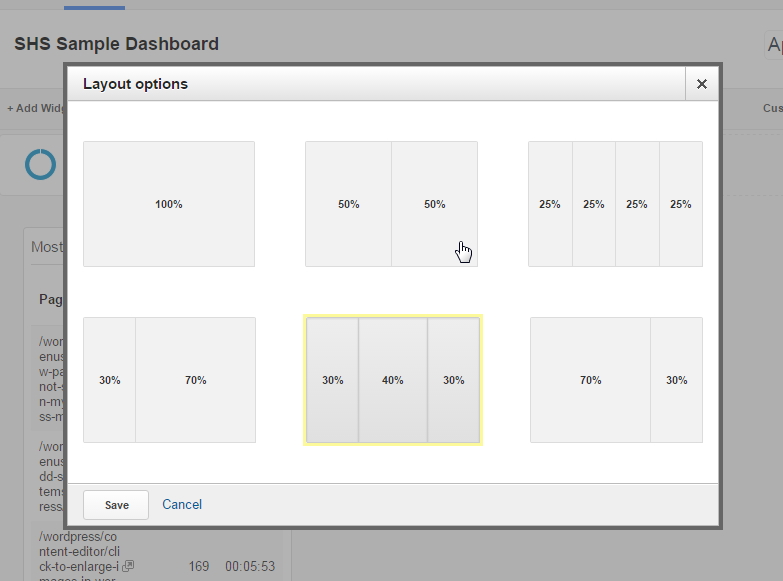
In this case I’m going to choose the 50-50 layout, to give our widgets more breathing room.
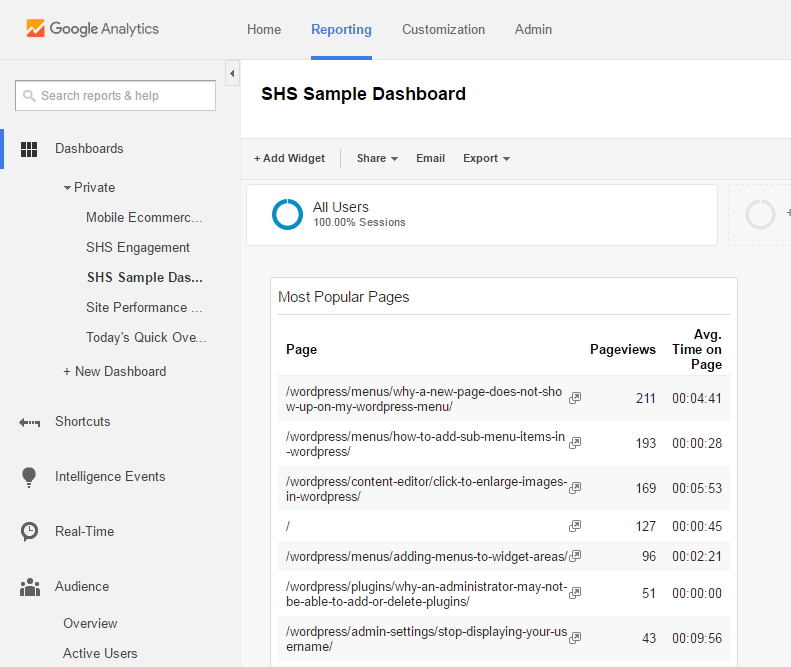
Within your dashboard layout, you can also drag and drop widgets to re-arrange them however you want.
And there you have it – the start of your own custom dashboard.
Like any Google Analytics report, you can have your dashboard emailed to you at regular intervals or you can download the data to put in a spreadsheet.
Keep in mind that you can create not just widgets, but any number of these dashboards. You could have one for data on your pages, one for data on ecommerce, one for data on mobile use, and so on. The key is to keep things simple for yourself so that you can quickly keep an eye on how your site is doing.
What's Your Take?