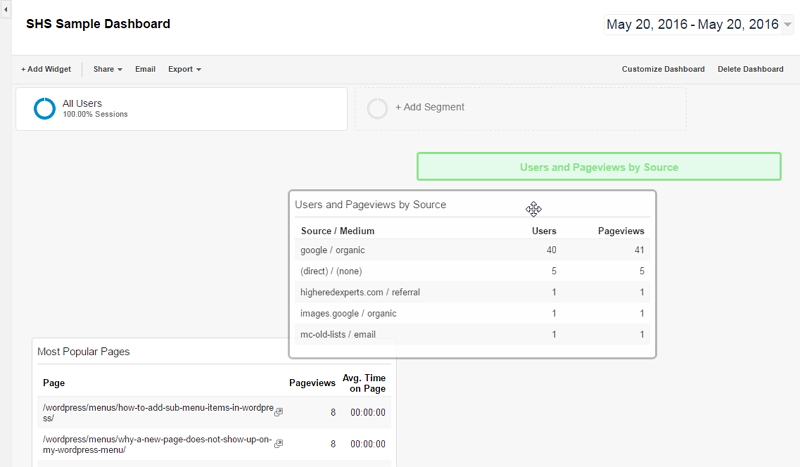
As part of our Google Analytics custom dashboard series, I’m going to add a new widget to show Users and Pageviews by their Source. This is a quick way of telling me whether more people are getting to my site from search engines or social media or other websites and so on. And it also tells me if they’re looking at more than just one page when they get there.
How to Add and Configure the Widget
These are the steps to take.
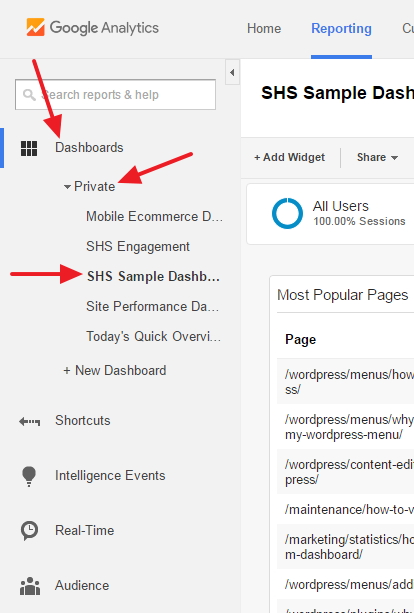
Navigate to Your Private Dashboard
This is the one you created in the first part of this series.
Add a Widget
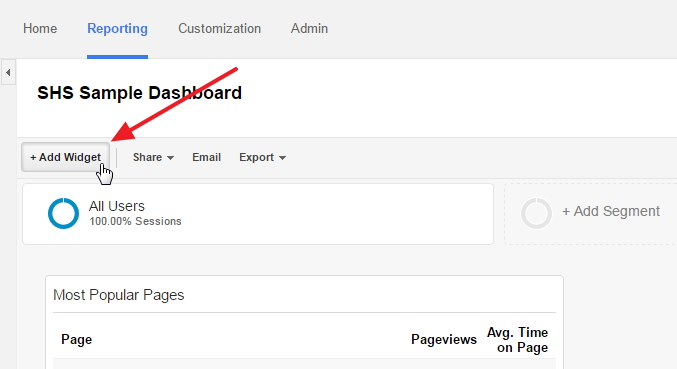
Just under the name of your Dashboard at the top left is the Add Widget button. Click that and you’ll get a popup window.
Name Your Widget and Choose the Type
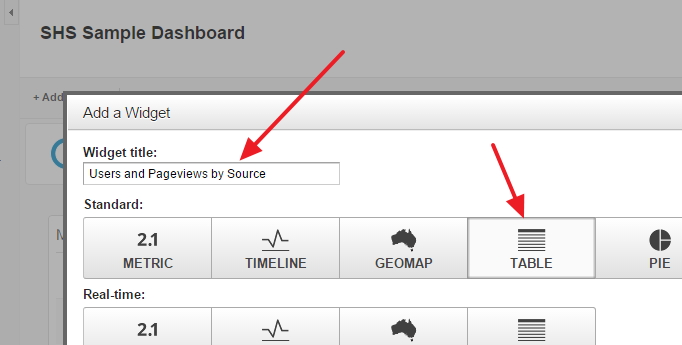
The title you give this widget will appear on your Dashboard. Make it something that tells you right away what the statistics are about.
For the Type of widget, we want a Standard one using a Table structure.
Choose a Dimension
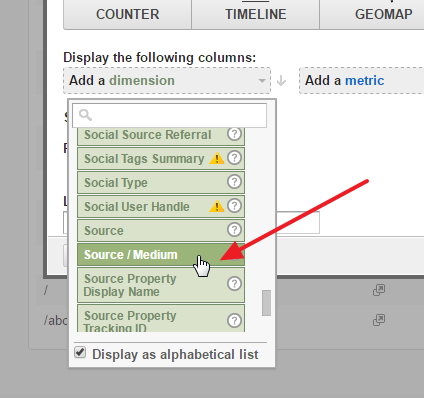
The dimension is the measure by which everything in the table will be broken down. In this case, we’re interested in where our visitors are coming from, so from the dropdown list of possible dimensions, choose Source/Medium.
The Source is the specific identity (Google vs Facebook vs Wikipedia, etc.) while Medium tells us the general category of the source (was it an organic search or a referral or from an email, etc.).
Add the Users
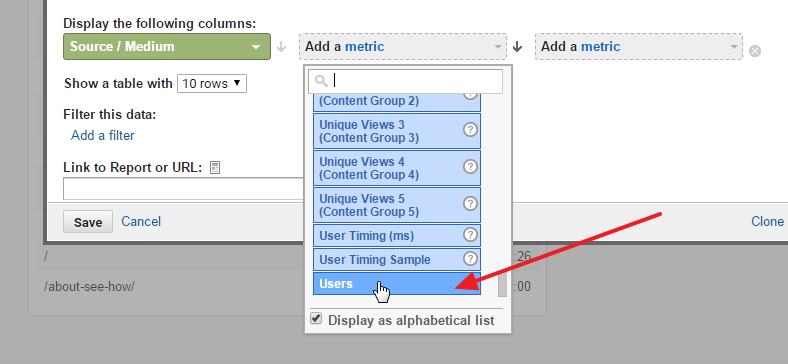
A metric is a statistic which will be broken down according to the dimension. We want to know how many users are coming from each of our Sources, so from the metric dropdown, choose Users.
Users are unique visitors. If someone came back to our site twice in a day, that would be two Sessions. If we used Sessions as our metric, it would look like two people visited instead of just one.
Delve more into the topic of sessions vs visitors vs pageviews.
Add the Pageviews
In addition to how many visitors are coming from which source, we want to know how many pages are being viewed during those visits.
As you may have noticed, the metrics dropdown has a LOT of options. If you know which one you want, you can start entering its name in the search field at the top of the dropdown. That will quickly take you to the section with your metric – in this case, Pageviews.
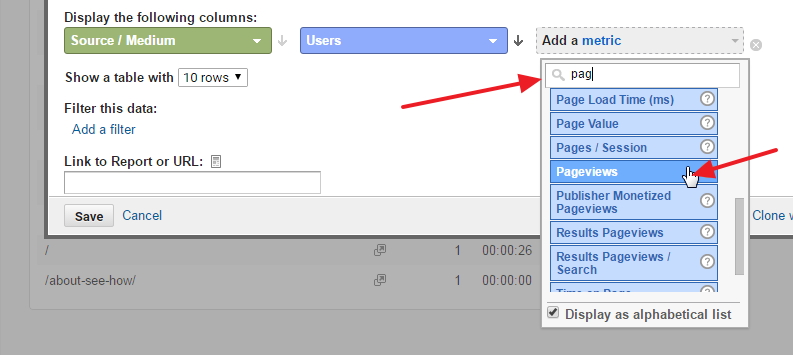
Once you’ve added the Pageviews metric, you can click Save at the bottom left of the popup window.
Your new widget will appear at the very top of your Dashboard.
Organize Your Dashboard
You can then drag it to any location on the page to organize your widgets however you like.
What's Your Take?